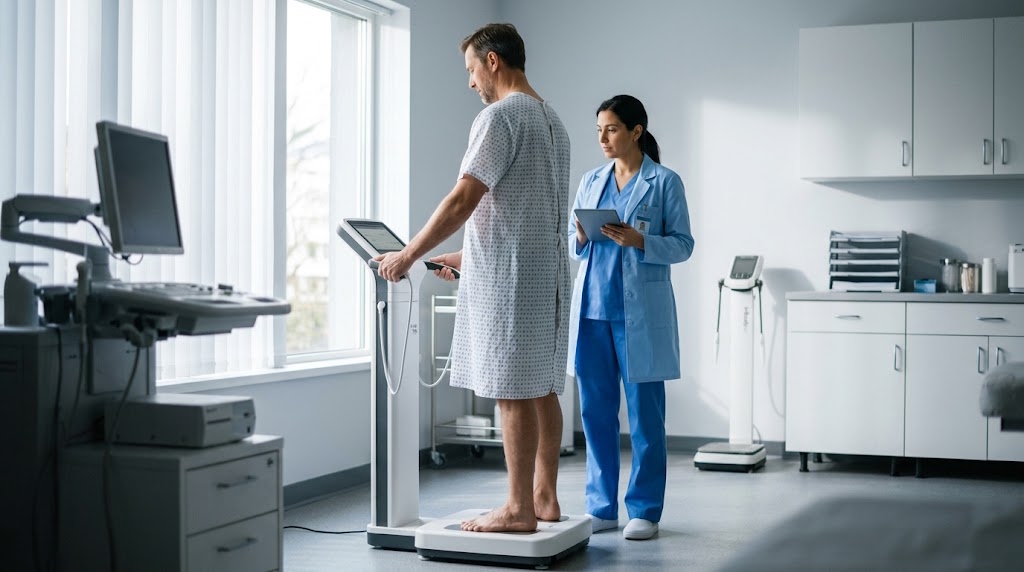
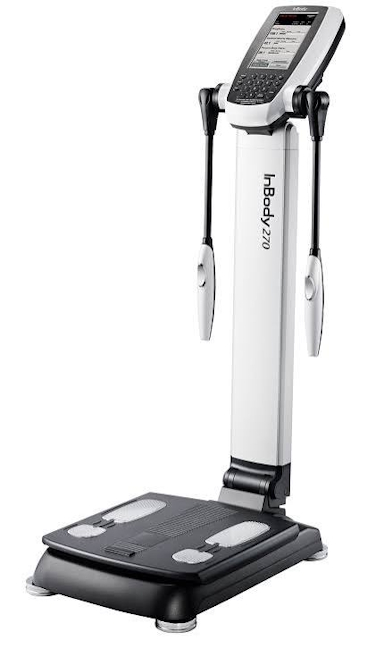
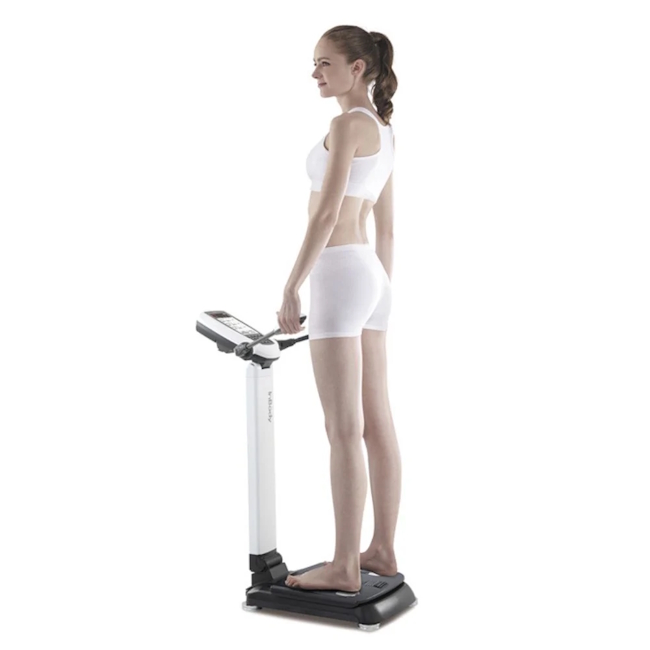
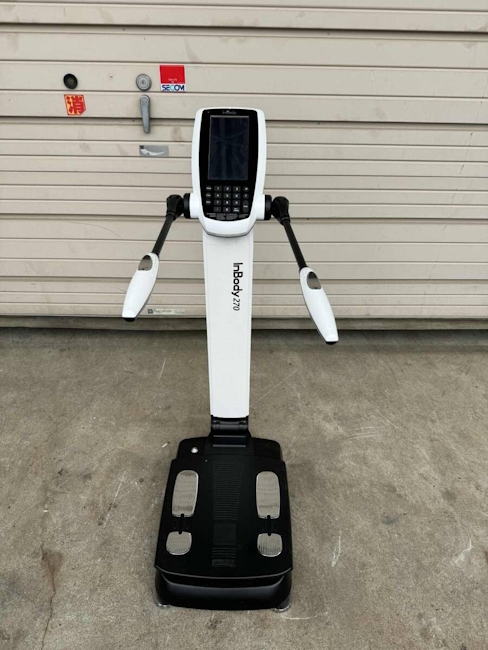
Diagnostics of body composition using expert-grade devices such as InBody are based on direct segmental multifrequency bioelectrical impedance analysis (DSM-BIA). Devices of this type are commonly referred to as a Body Composition Analyzer, and in this case the model is the InBody 270S.
The technology works by passing weak, completely safe alternating electrical currents of different frequencies through the body. The analyzer’s platform and hand grips are equipped with contact electrodes that generate electrical impulses and measure how they travel through different anatomical structures.
Using a broad frequency range from 1 kHz to 1 MHz allows the current to pass through both the extracellular space and across cell membranes into the cells themselves, providing detailed information about tissue hydration at every level.
The method relies on a fundamental difference in the electrical conductivity of biological structures:
Skeletal muscle and blood contain large amounts of water and dissolved electrolytes, making them excellent conductors with very low resistance.
Fat tissue and bone, by contrast, contain very little fluid and therefore have high impedance, acting as physical electrical insulators.
The device continuously records two physical parameters: active resistance (resistance to current flow) in fluid-based tissues and reactance (capacitance) created as the current crosses cell membranes. This allows the system to distinguish muscle fibers from lipid deposits.
Before the scan begins, the operator enters the patient’s basic anthropometric data into the system—height, age, and biological sex.
Accurate height is critical for the initial calculations: from the standpoint of the device’s physical model, the human body is treated as a cylindrical conductor, and height determines its length. Without an accurate height measurement, the software cannot correctly calculate total body water.
Age and sex have historically been used to adjust results through population-based formulas, but modern professional analyzers rely primarily on the actual electrical resistance of the individual’s tissues, using demographic information mainly to establish personalized reference ranges on the final report.
Based on the measured electrical resistance, the algorithms calculate a complex set of parameters, including total body water, protein mass, mineral mass, fat mass, and skeletal muscle mass. Measuring protein and intracellular electrolytes allows physicians and trainers to assess the actual condition of muscle cells and identify protein deficiency, depleted reserves, or hidden peripheral edema. Skeletal muscle mass is calculated directly from intracellular fluid volume, while fat mass is derived mathematically as the difference between total body weight, measured by the high-precision scale built into the platform, and the patient’s calculated fat-free mass.
Parameter Accuracy, Sources of Error, and Clinical Measurement Guidelines
Segmental scanning allows the device to assess not just the body as a whole but each of five anatomical segments separately: the right and left arms, the legs, and the trunk.
This diagnostic approach substantially increases the amount of useful information available, allowing specialists to identify muscular asymmetry after injuries or strokes, as well as specific imbalances in muscle development. Particular attention goes to the abdominal region: the device estimates visceral fat, which accumulates around the internal organs in the abdominal cavity and is described as a major metabolic risk factor for diabetes and cardiovascular disease.
From a clinical perspective, bioelectrical impedance analysis offers high, but not absolute, accuracy and remains below the medical gold standard of dual-energy X-ray absorptiometry (DEXA). Professional multifrequency systems have an instrumental error of about 2–4% when estimating body fat percentage, making the method a practical and reasonably reliable tool for tracking changes in body composition over time. However, this baseline accuracy is maintained only when the patient’s fluid balance is tightly controlled because the device’s mathematical algorithms inevitably interpret sharp shifts in hydration as changes in muscle or fat tissue.
The body’s current physiological state at the moment the skin contacts the platform electrodes can have a major effect on the scan results. Drinking a liter of water immediately before testing, eating a large carbohydrate-heavy meal, performing intense resistance training that causes a strong increase in blood flow to the muscles (a pump), or recently taking diuretics can significantly distort the overall electrical conductivity profile. For example, severe physiological dehydration artificially increases tissue resistance, which can cause the device to overestimate body fat, while pronounced lower-leg edema may instead be interpreted by the software as a sharp increase in skeletal muscle mass.
To obtain the most reliable and reproducible body-composition metrics possible, measurements should be performed under standardized conditions that minimize external sources of distortion.
The ideal testing protocol calls for a morning scan, strictly fasting, with normal hydration, after emptying the bladder and before any strenuous physical activity. The main value of bioelectrical impedance analysis lies not in recording one isolated set of numbers but in consistently monitoring physiological trends: only a series of properly performed measurements can objectively show whether a person is losing body fat or valuable muscle tissue during a calorie-controlled diet.
Example Analysis
These tests are commonly available here in the U.S. either free of charge as entertainment in shopping malls, at self-service stations for a nominal fee, or in medical facilities and some gyms.
Input data:
43 years old
Height: 72.5 inches (184 cm)
Natural athlete
4 years of training
Click to enlarge the image:
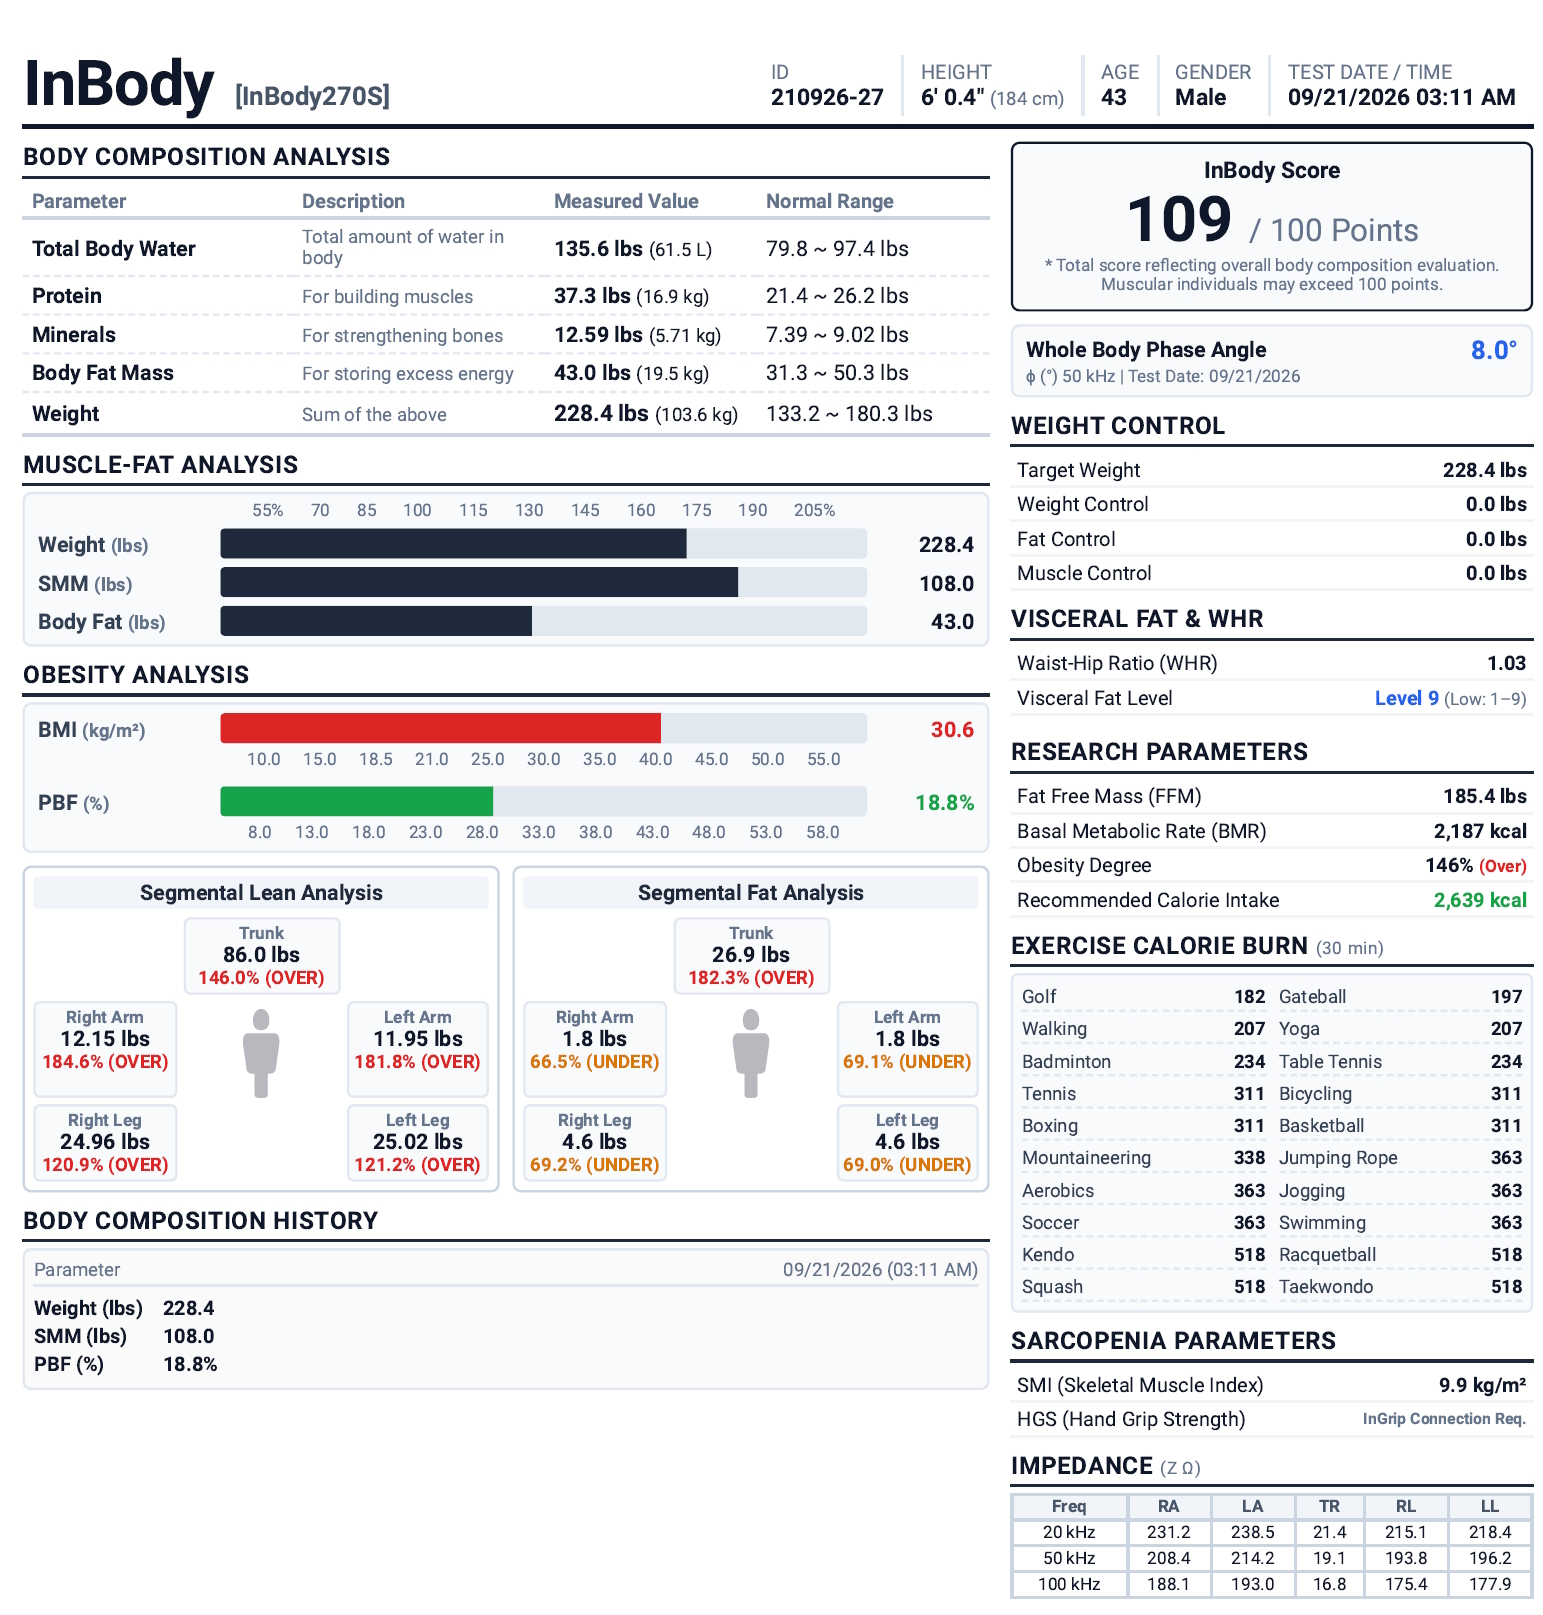
The InBody 270S results present a fairly consistent picture: 184 cm, age 43, 103.6 kg (228.4 lb), 18.8% body fat, and 84.1 kg FFM (185.4 lb).
For a natural athlete with roughly four years of training, the muscle-mass measurements are very high. No surprise that he trains with me. I generally don’t take natural athletes under my supervision, but this was a special case.
So, what do we have:
Weight — 228.4 lb (103.6 kg) Weight is high for a height of 184 cm, but on its own it tells us little here: most of it comes from fat-free mass.
Body Fat Mass — 43.0 lb (19.5 kg) The amount of fat mass is moderate relative to total body weight. This corresponds to 18.8% body fat.
Percent Body Fat — 18.8% For a training male, this is clearly not a level of pronounced excess body fat. At the same time, visible definition depends significantly on fat distribution and individual body composition.
Fat-Free Mass — 185.4 lb (84.1 kg) Very high fat-free mass for a height of 184 cm. This metric best explains the body weight of 228 lb.
Skeletal Muscle Mass — 108.0 lb This is one of the strongest numbers on the report: there is a large amount of muscle even relative to the high total body weight. For a natural athlete, four years of training are consistent with this picture.
BMI — 30.6 kg/m² On the standard BMI scale, this falls into the obesity range, but in this case the value is strongly influenced by muscle mass. With 18.8% body fat, BMI cannot be interpreted separately from body composition.
Total Body Water — 135.6 lb (61.5 L) A high value, which makes sense given the large fat-free and muscle mass. Water accounts for approximately 59% of body weight.
Protein — 37.3 lb (16.9 kg) The high protein mass reflects the large volume of fat-free tissues, particularly muscle.
Minerals — 12.6 lb (5.71 kg) The bone and mineral component is high and consistent with the individual’s overall large fat-free mass.
InBody Score — 109/100 This report shows the kind of pattern in which the score exceeds 100 because of a pronounced muscular component. InBody itself indicates that a muscular person can receive a score above 100.
Whole Body Phase Angle — 8.0° A very strong value for a person of this age and build. A high phase angle is generally associated with greater cellular mass and healthy cell membranes, but it is not a standalone health diagnosis.
Waist-Hip Ratio — 1.03 This value is above the desirable range shown on the report itself. In other words, despite the overall muscular body composition, fat distribution around the waist remains a separate parameter.
Visceral Fat Level — 9 InBody places the value directly below the 10 mark. This matters more than the overall body-fat percentage because it specifically reflects an estimate of visceral fat.
Basal Metabolic Rate — 2187 kcal/day The estimated resting energy expenditure is fairly high, which is expected with 84.1 kg of fat-free mass. This is not the person’s total daily calorie requirement but an estimate of energy expenditure at rest.
Recommended Calorie Intake — 2639 kcal/day This is an InBody calculation, not a personally calculated sports nutrition target. For an athlete who trains regularly, actual TDEE will generally be higher than resting expenditure and will depend on training and activity levels.
Obesity Degree — 146% This parameter is often misread: it is not 146% body fat and not 146% obesity. It is a relative measure comparing body weight with the InBody calculated standard; in a highly muscular person, it can appear high.
Target Weight — 228.4 lb (103.6 kg) InBody does not actually recommend weight loss here: the Target Weight matches the current weight. Weight Control, Fat Control, and Muscle Control are all 0.0 lb.
SMI — 9.9 kg/m² A very high skeletal muscle index. The report lists <5.5 as the sarcopenia-risk threshold, so 9.9 is substantially above it.
HGS — Hand Grip Strength No grip-strength value was obtained during this test: the device displays “Grip Connection Required”. Therefore, no conclusion can be drawn from this parameter.
Segmental Lean — arms Approximately 5.4–5.5 kg of fat-free mass per arm, about 182% of the InBody reference value—well above the standard. The asymmetry between the arms is small.
Segmental Lean — trunk About 39.0 kg, approximately 146% of the standard value. This is a very large amount of trunk lean mass and one of the main reasons for the high overall FFM.
Segmental Lean — legs Both legs are also above the standard level; both sides reads 11.35 kg / 121.2%.
Segmental Fat — arms Approximately 0.8 kg per arm, or about 1.8 lb total. InBody classifies both sides as Under, meaning there is relatively little fat mass in the limbs.
Segmental Fat — trunk 12.2 kg (26.9 lb), 182.3% of the standard value—the primary area where fat tissue is concentrated. This is consistent with a WHR of 1.03.
Segmental Fat — legs Approximately 2.1 kg (4.6 lb) per leg, about 69% of the standard value; InBody classifies both sides as Under. In other words, fat is distributed unevenly, with substantially more concentrated around the trunk.
Overall Body Composition Summary The defining feature is not simply high body weight but very high muscle and fat-free mass at 18.8% body fat. BMI is high largely because the standard BMI formula does not distinguish between 108 lb of skeletal muscle and fat tissue.
What Stands Out Most in a Natural Athlete 84.1 kg FFM + 108 lb SMM + phase angle 8.0° + SMI 9.9 describe a person with very highly developed fat-free mass. The one notable body-composition feature that stands apart is the relatively greater accumulation of fat around the trunk.
For a sports-focused analysis, the most informative relationship here is 18.8% BF → 185.4 lb FFM → 108 lb SMM → 8.0° phase angle: it describes this person’s physique better than BMI or body weight alone.
Bioelectrical Impedance Analysis in Bodybuilding
Bioelectrical impedance analysis, as explained above, evaluates body composition by passing a weak electrical current through the tissues. Muscle is an excellent conductor because it contains large amounts of water, while fat creates resistance.
When testing bodybuilders, especially professional enhanced athletes, meaning those using pharmacological support, InBody algorithms often encounter measurements that fall far outside normal physiological ranges.
Anabolic steroids and growth hormone can cause substantial intracellular fluid retention and atypical hypertrophy, leading the device to record unusually high conductivity. As a result, the system may distort the proportions of lean mass and produce values far outside the ranges shown in its built-in graphs, which were originally designed around the average person.
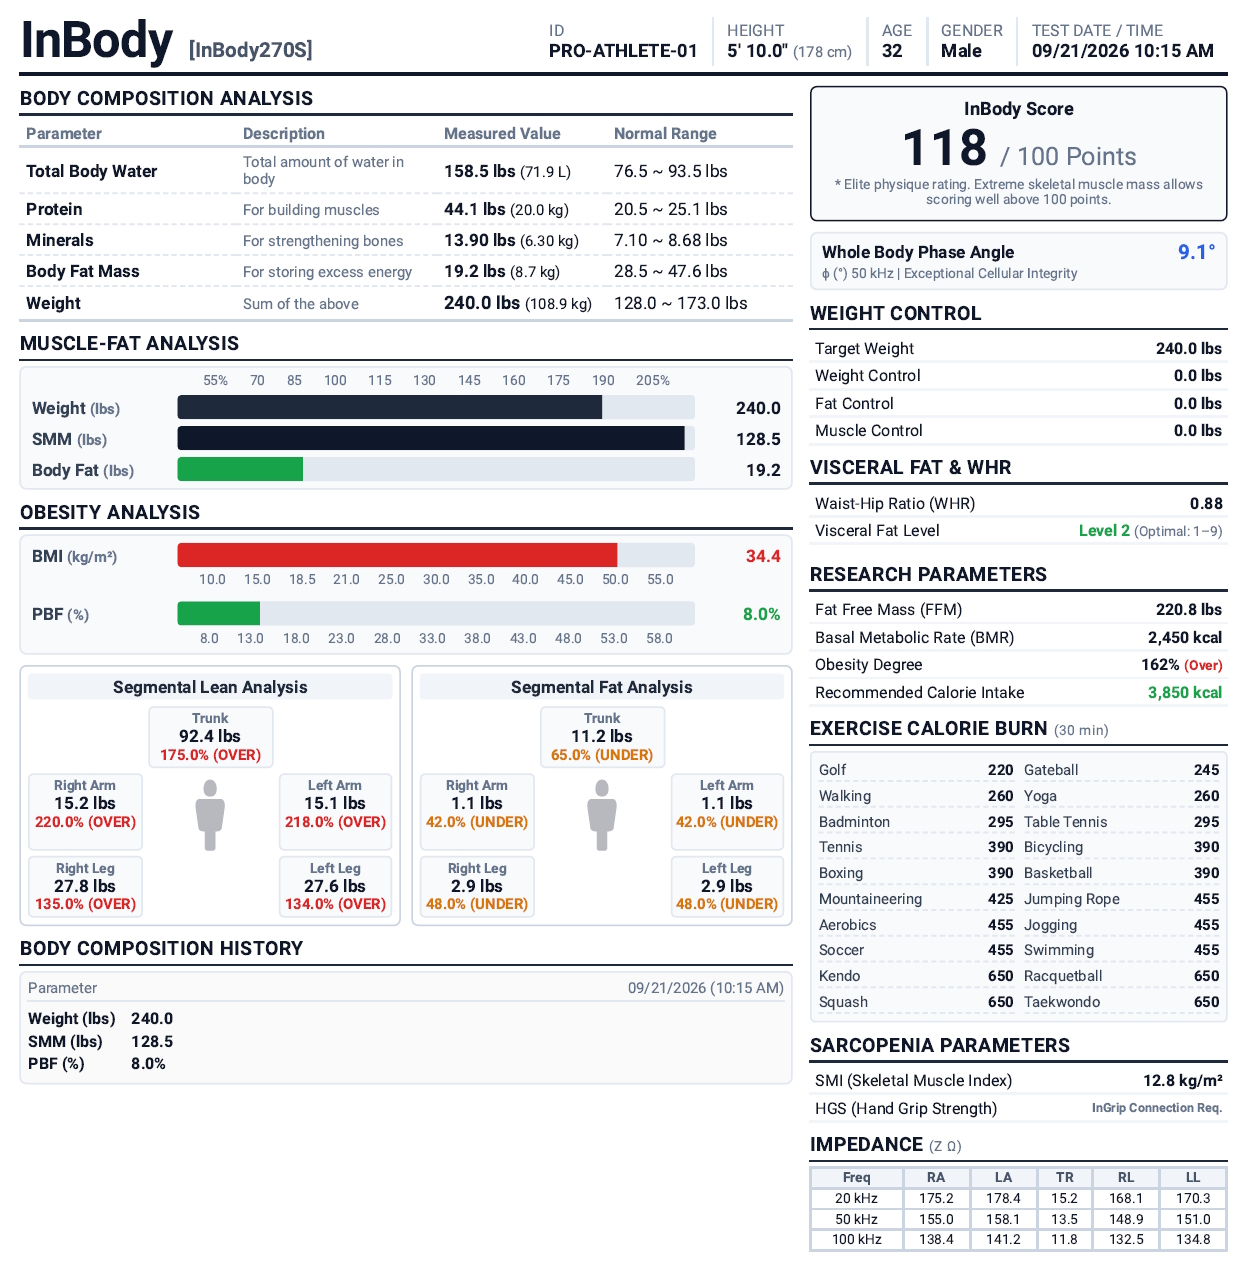
Let’s analyze the basic InBody test metrics using the example of a client, age 32, height 70 inches (178 cm):
And here is the actual test result. Click to enlarge the image:
Weight and Body Mass Index (BMI). BMI in these athletes can move firmly into the red-zone “class II or class III obesity” range because the medical formula considers only the relationship between height and weight. Pharmacological support can increase muscle volume to levels that are physically unattainable naturally, creating a paradox: at a body weight above 250 pounds, a bodybuilder can have an ideal competition-level physique.
Skeletal Muscle Mass (SMM). The skeletal muscle measurement can exceed the upper limits of InBody’s graphs, showing a bar extending beyond 200% of the reference range. Exogenous testosterone and its derivatives accelerate protein synthesis, allowing muscle fibers to accumulate substantial amounts of sarcoplasm and glycogen in response to resistance training.
Percent Body Fat (PBF). Body fat can fall to an extreme 7–8%, accompanied visually by pronounced vascularity, muscle separation, and thinner skin. Fat-burning drugs, stimulants, and growth hormone strongly increase lipolysis, preventing the body from storing triglycerides even in the presence of a very large calorie surplus.
Total Body Water (TBW). The analyzer records very large amounts of fluid, which form the basis of hypertrophied, visibly dense muscles. Anabolic drugs can cause substantial retention of intracellular water, giving the musculature the “full” and dense appearance typical of heavyweight bodybuilders.
InBody Score. The device’s final score can easily exceed 115–120 points, effectively breaking the standard 100-point system. This index automatically rises in proportion to every pound of muscle mass above the average reference level, making the overall score inapplicable to professionals.
Visceral Fat Level. The amount of visceral fat surrounding the organs remains at minimal levels (1–2) because of a strict diet and high metabolic rate. Even when the waist appears wide or the abdomen looks larger because the internal organs themselves have increased in size from peptide use, there is practically no actual fat depot there.
Bioelectrical impedance analysis perceives a bodybuilder using performance-enhancing drugs as a statistical anomaly.
The device is useful for tracking changes in physique during contest preparation, but its absolute medical scales lose meaning when confronted with extreme hypertrophy and an artificially altered fluid and electrolyte balance.
For these athletes, InBody serves less as a tool for diagnosing health and more as a precise tracker of progress between cycles and cutting phases.
Dmitry Volkov – is the author of our bodybuilding section is a practicing sports medicine physician based in Dallas, Texas, with 21 years of hands‑on experience in sports pharmacology. At 42, he combines deep academic knowledge with real‑world expertise gained from coaching athletes of all levels — from amateurs to seasoned competitors. He earned his medical degree from a leading Texas institution and spent years working in sports medicine clinics and private practice.
His primary focus is hormonal regulation of muscle growth, the use of anabolic steroids and peptides, and post‑cycle recovery. He understands modern protocols inside out because he consults real people every day, helping them avoid side effects and achieve safe results. His approach is rooted in evidence‑based medicine, yet remains grounded in the realities of both amateur and professional sports.
In his articles, he aims to debunk myths and deliver clear, scientifically sound recommendations. Every piece of content is vetted not only by medical knowledge but also by years of clinical observation. He firmly believes that responsible pharmacology requires a solid grasp of biochemistry, respect for one’s body, and regular medical monitoring — and he works hard to convey these principles in a way that is both accessible and actionable for his readers.